|
Data Trends
Price Indices For Hong Kong Property Market

Rental Indices For Hong Kong Property Market

Trans. Trend - HOS Average Price per Square Feet
Comparison Chart for Primary and Secondary Residential Units
ASP Statistics
Commission Index
Licence
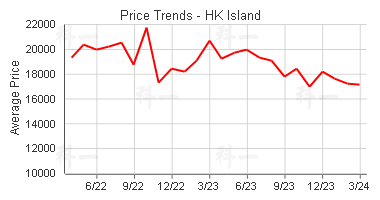
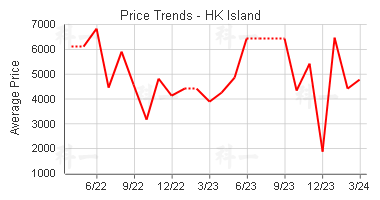
Price Trends - Hong Kong Island
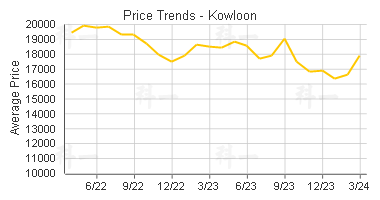
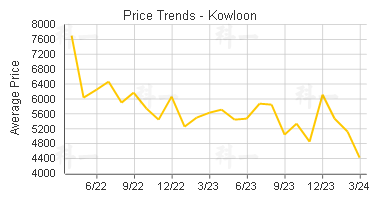
Price Trends - Kowloon
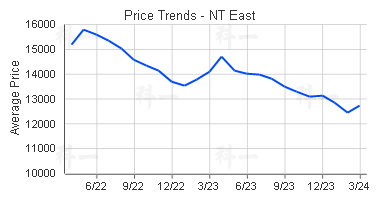
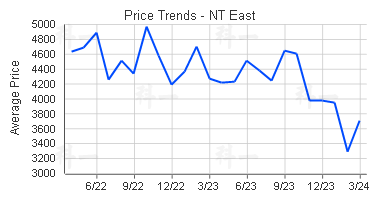
Price Trends - NT East
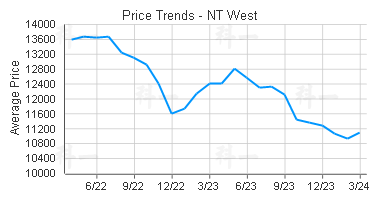
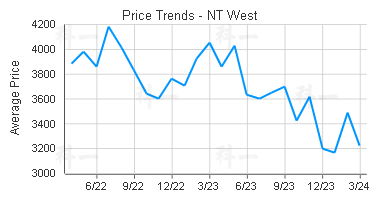
Price Trends - NT West
Advertisement
HK Island Industrial Price Trends Per Month
Kowloon Industrial Price Trends Per Month
NT East Industrial Price Trends Per Month
NT West Industrial Price Trends Per Month
Disclaimer:
The statistics provided in this Web Site are for reference only. While every effort has been made to ensure the accuracy of the statistics, Property.hk shall accept no responsibility for any errors, omissions or misrepresentations in the statistics. In no event shall Property.hk be held liable for any loss or damage whatsoever arising directly or indirectly from the use of or inability to use the statistics provided in this Web Site.
|
|